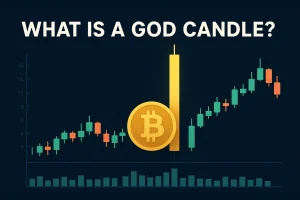
What Is a God Candle? Definition & Crypto Examples
What Is a God Candle? The Crypto Chart Pattern Everyone Whispers About
A god candle is the industry’s equivalent of a lightning bolt: one large, fat green bar that blasts through resistance and has traders scrambling to get caught up. Below we dissect why it happens, what it means, and how to spot the next one before it scorches your screen.
1. Definition in Plain English
God candle is a behemoth daily candle—typically +10 – 25 % in crypto—that opens near the low, closes near the high, and dominates all else by comparison. Volume spikes, liquidity evaporates, and order books can’t refill rapidly enough.
2. Where the Term Came From
The nickname surfaced on Bitcointalk a decade ago, then caught fire in 2017 when Bitcoin printed back-to-back vertical moves. Traders half-joked that only a deity could launch price that hard—hence the name. The meme still lives on X, TikTok, and Farcaster every time a candle looks like a skyscraper.
3. Anatomy of a God Candle
| Component | Typical Signature | Why It Matters |
|---|---|---|
| Body size | Daily close +10 – 25 % | Separates it from “healthy” candles |
| Volume spike | 2-4× 30-day average | Confirms real demand, not just thin books |
| Wick length | Minimal | Buyers held control through the close |
| Context | Follows tight consolidation | Compression stores the “fuel” |
4. Legendary Examples
Bitcoin — 2 April 2019
After weeks of sideways movement, BTC jumped from $4 100 to $5 100 in 24 h. Half-a-billion dollars’ worth of shorts were squeezed, and it supported a self-sustaining rally.
Ethereum — 27 July 2020
ETH shattered +12 % the day DeFi Summer ignited. Daily active addresses registered 30 % supply growth that week, and on-chain momentum kept track with the chart.
Bitcoin — 28 February 2025
Spot ETF inflows were more than $1 B one day, miners stopped selling, and BTC blasted +18 % to reclaim $60 K. On-chain data showed 17 000 coins withdrawn from exchanges—typical liquidity vacuum.
5. On-Chain and Macro Triggers
- Exchange Outflows: Whales move coins to cold storage, reducing supply for tradable purposes.
- Derivatives Squeezes: Big short open interest + small bull push = chain reaction of liquidations.
- Macro Catalysts: ETF clearances, dovish rate surprises, or unexpected risk-on pivots power the move.
6. How Traders Use (or Misuse) Them
Breakout confirmation: others wait for a daily close above resistance on blockbuster volume, then ride the retest.
Gap-and-go: scalpers ride the first shallow pullback in the top half of the candle.
Danger zone: pursuing the candle’s top tends to leave them in heartbreak when early buyers sell into late FOMO.
7. Common Myths Debunked
• “It guarantees a bull market.” Not by itself—see 2019.
• “Whales script every move.” Most candles come from feedback loops, not conspiracies.
• “If you weren’t long already, forget it.” Structured breakout trades still offer decent risk-reward on consolidations after the blast.
8. FAQ
How big does the candle have to be to qualify?
Traders refer to it as a god candle when the daily body is over about 10 % of price, although Bitcoin 20 % blowouts set the standard.
When was the latest Bitcoin god candle?
February 28, 2025 printed the latest textbook example, driven by runaway ETF inflows and a gigantic short squeeze.
Is a god candle always bullish?
By definition, it’s a giant green bar, but price may retrace hard afterwards. Use it as data—confirmation is in follow-through, not the candle.
9. Key Takeaways
- A god candle is a warning of an explosive imbalance between demand and supply.
- Watch on-chain flows and derivatives positioning to catch setups early.
- Enjoy the fireworks, but watch out for risk—vertical moves reverse faster than they go up.
➔ Post created by Robert AI Team