Silver Price Forecast 2025-2030 | Daily Updated Outlook
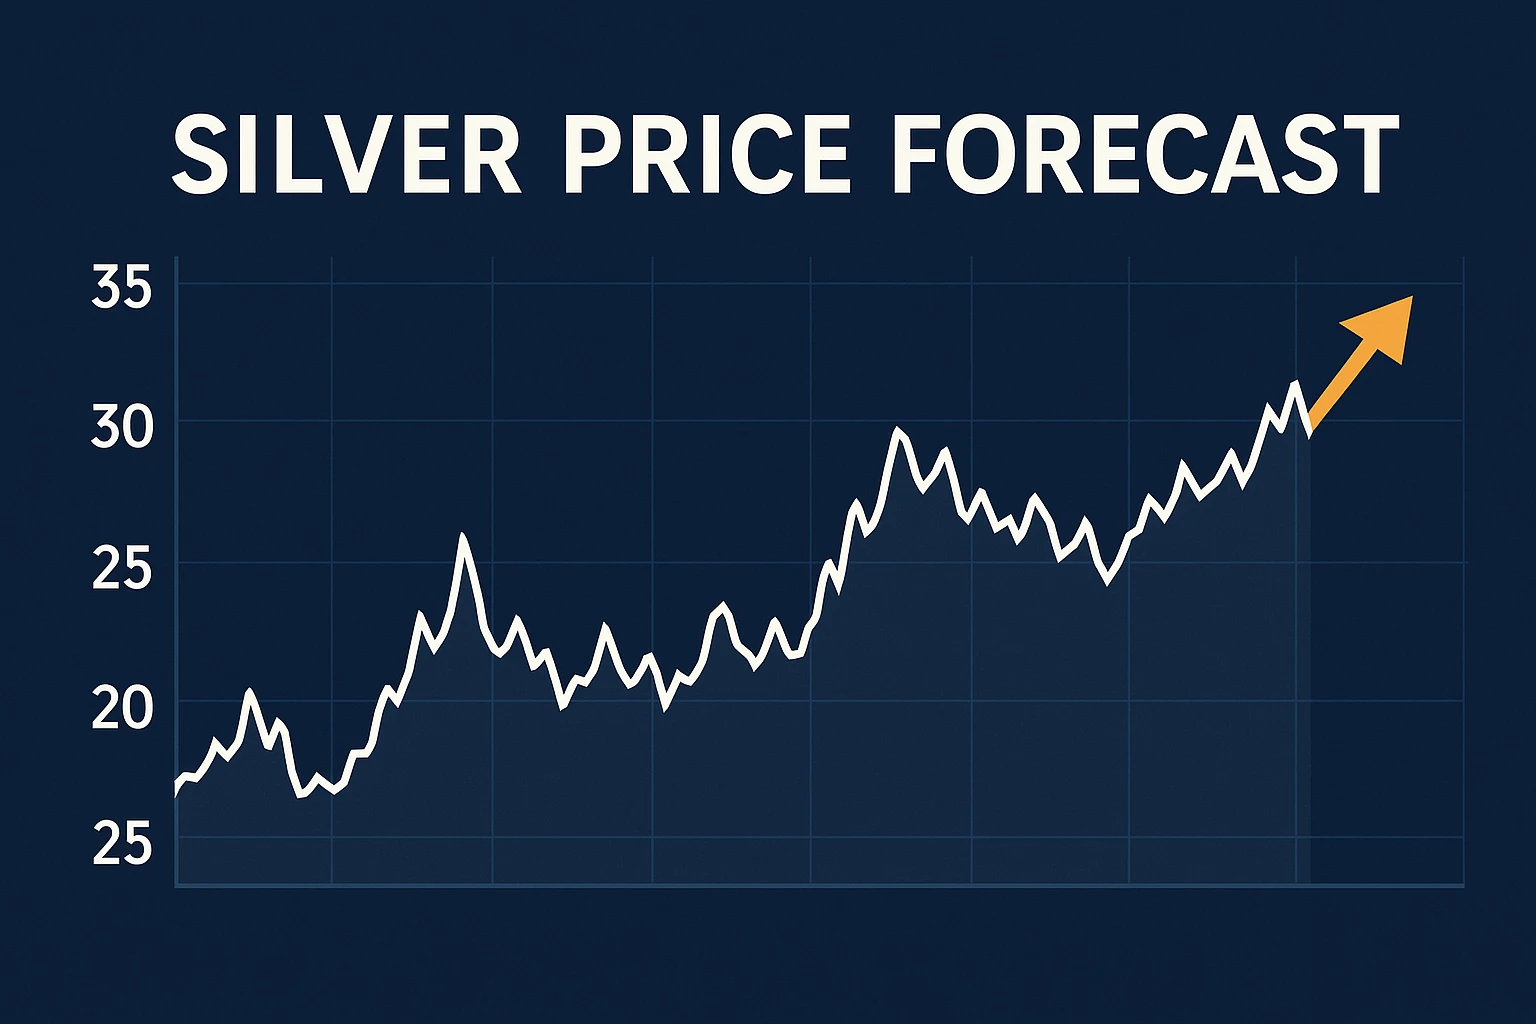
Silver Price Forecast – Updated May 4 2025
At $32.98 / oz on April 25 2025, silver is up almost 14 % year-to-date and trading near the top of its twelve-month range.
Our models point to a $34 – $38 band by Q3 2025, a mild pull-back into year-end as U.S. real rates normalise, and a structurally higher
$40 – 55 trajectory by 2030 on tightening mine supply, accelerating green-tech demand and a re-leveraging gold-to-silver ratio.
1 | Current Spot Price at a Glance
- Last price – $32.98 / oz (LBMA PM fix, 25 Apr 2025)
- Month-to-date performance: +6.5 %
- 52-week range: $27.12 – $33.70
- Gold-to-silver ratio: 99 (down from 112 on Jan 1)
2 | Key Drivers in 2025
| Driver | Current Reading | Directional Impact |
|---|---|---|
| Real 10-yr U.S. yield | 1.05 % (+45 bp YTD) | Negative – higher carry cost |
| Fed policy outlook | First rate cut priced for Sep 2025 | Positive – reflation trade |
| Industrial demand | Solar installs +24 % YoY; EV share 39 % | Positive – demand uptrend |
| Mine-supply growth | +1 % YoY (lowest since 2016) | Positive – constrained supply |
| Investor ETF flows | Holdings +3 Moz since Jan | Neutral – below 2021 peak |
3 | Short-Term Forecast — Next 3 Months
Our macro-quant model (futures curve, COMEX positioning, DXY, real yields) projects a $34 – 38 range for May–July 2025 with a 60 % probability of a
new cycle high above $34.50. Biggest risk: hotter-than-expected U.S. core PCE that delays Fed easing.
4 | Medium-Term Forecast — 2025-2026
| Quarter | Forecast Avg | Main Catalyst |
|---|---|---|
| Q4 2025 | $31.50 | Seasonal surplus + stronger USD |
| Q2 2026 | $36.00 | First Fed cut + Asian solar build-out |
| Q4 2026 | $39.00 | Mine-supply deficit widens to 150 Moz |
5 | Long-Term Outlook — 2030-2040 Scenarios
Electrification, green hydrogen, and limited new high-grade deposits underpin our base case that silver clears its 2011 high ($48.70)
by 2029, settling into a $50 – 55 equilibrium band through 2030-34. Upside to $60+ requires another macro-instability shock
that channels safe-haven flows into precious metals.
6 | Bull / Base / Bear Case Table
| Scenario | 2025 Target | 2026 Target | 2030 Target | Probability |
|---|---|---|---|---|
| Bull – global easing + supply shock | $40 | $46 | $65 | 25 % |
| Base – gradual reflation | $34 | $39 | $52 | 55 % |
| Bear – prolonged high rates | $28 | $30 | $35 | 20 % |
7 | Investment Implications
- Physical bullion & allocated storage remain the cleanest play on tight supply.
- SLV-style ETFs offer liquidity; watch fees and tracking error.
- Primary-silver miners (≥60 % revenue from Ag) give torque if spot breaches $40.
- Options: sell cash-secured puts at $30 strike (Jan 2026) for ~9 % annualised yield.
- With equity correlation near 0.2, silver is a pragmatic inflation-hedge diversifier.
8 | FAQ
Will silver hit $50 again?
Our base-case model reaches $50 by 2029; an earlier move is possible if Fed easing coincides with a supply disruption.
Is silver still cheap versus gold?
Yes. The gold-to-silver ratio (≈99) remains well above its 50-year average of 65, implying 40-50 % upside if it mean-reverts.
What’s the biggest short-term risk?
A hawkish surprise from the Fed or a DXY spike above 110 could shave $2-3 off spot in days.
Disclosure: Forecasts are opinion, not investment advice. Consult a licensed professional before trading commodities.