Opening Range Breakout Strategy
Opening Range Breakout: Mastering the Strategy for Consistent Profits
Opening Range Breakout (ORB) is a popular trading technique among traders of different markets like stocks, forex, and cryptocurrencies. The technique tries to take advantage of volatility witnessed at the beginning of a trading session and is therefore one of the popular techniques embraced by day traders and short-term traders who eagerly anticipate benefiting from short-run spikes in momentum. By identifying breakdown of price from an early “opening range” of a market, purchasers can place high-probability trades.
Below in this article we will take you through Opening Range Breakout steps, the way it is used on different markets, and how you may use it in making your winning trades more solid.
Table of Contents
- What is the Opening Range Breakout?
- How to Identify the Opening Range
- Opening Range Breakout Strategy: Step-by-Step Guide
- Using Indicators with the Opening Range Breakout
- Risk Management in ORB Trading
- Final Thoughts
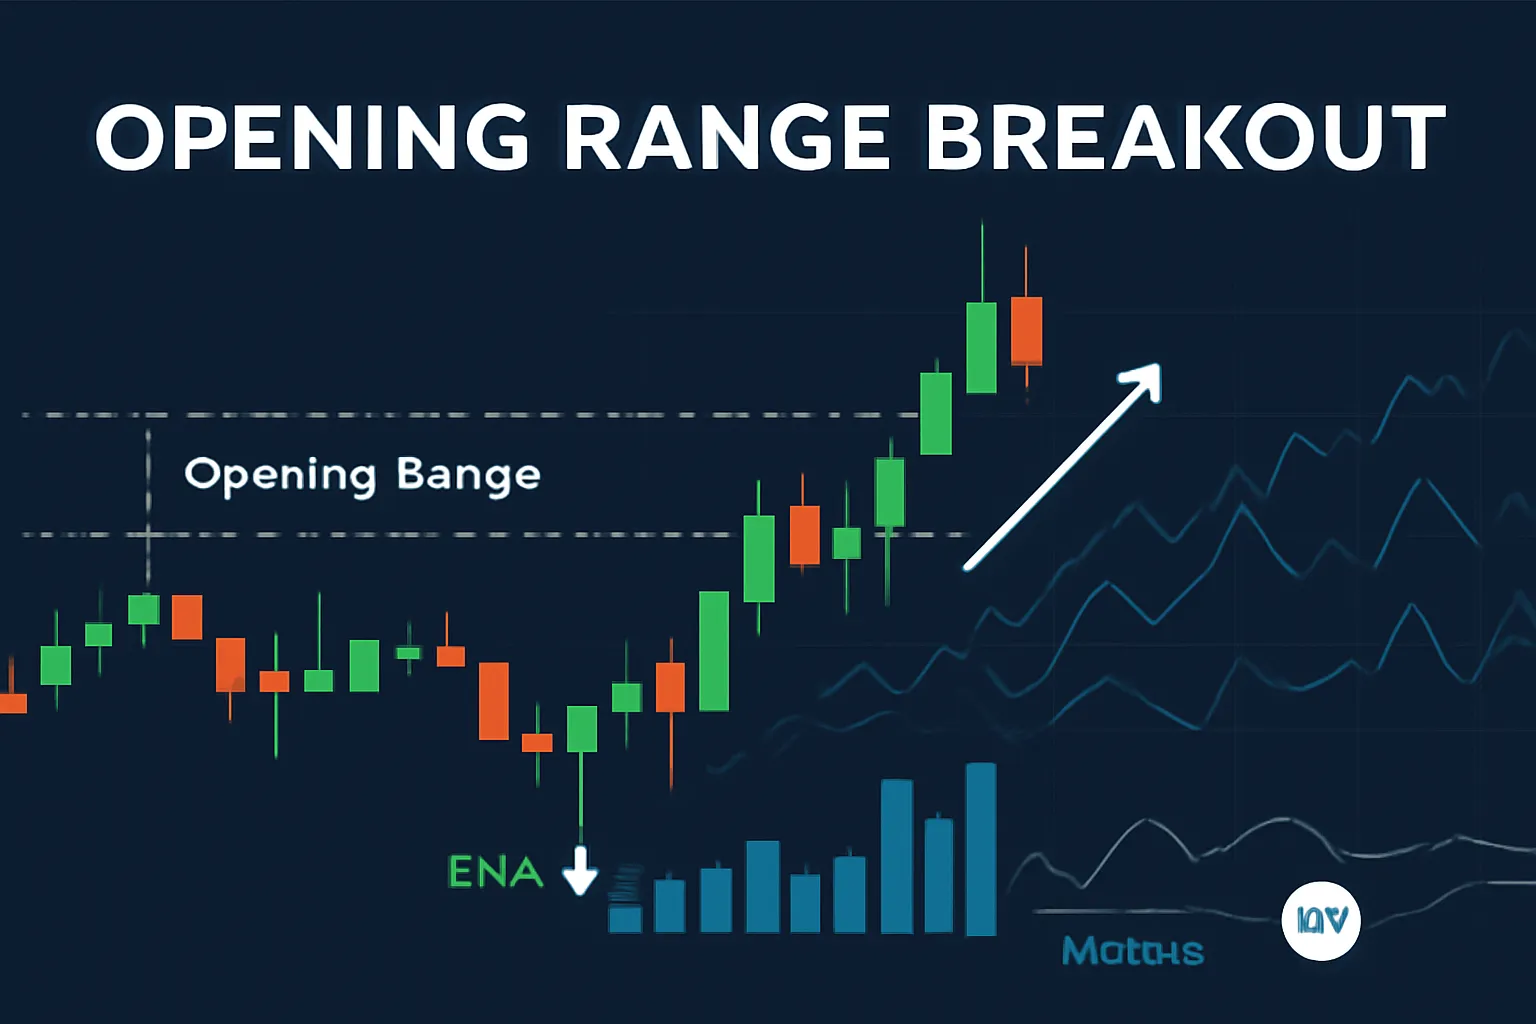
What is the Opening Range Breakout?
The Opening Range Breakout, ORB, is a method of trading which relies upon the early price action within a trading session. The “opening range” is the price range constructed during a certain time period at the start of the trading day (most commonly in the first 15 to 30 minutes). After the range is established, a breakout takes place when the price breaks above the high or below the low of the range, showing a new direction for prices.
The ORB principle is simple: early market action can give the trader a feel for the tone of the general market for the day. If the price is breaking above or below the opening range, then this is a sign that momentum is building in this direction.
How to Identify the Opening Range
The definition of the opening range is the first step to execute the Opening Range Breakout strategy. This is how you need to define it:
- Set the Time Frame: When dealing with stocks, it is generally the first 15 to 30 minutes of market opening. When dealing with more volatile forex and cryptocurrencies, the opening range can be a slightly shorter or a slightly longer period of time based on the volatility of the instrument.
- High and Low Identification: High and low levels within that initial time frame are the opening range. These levels are significant since they are the breakout levels.
- Plot the Range: Plot these levels on your chart with high and low instead. Breakout happens when the price goes above or below the opening range high or low, which is your entry into a trade.
Opening Range Breakout Strategy: Step-by-Step Guide
Now that the opening range is established, use the following rules to effectively implement the ORB strategy:
- Wait for the Breakout: Once the high and low of the opening range are established, wait for price to break out above or below the same. A breakout above the high indicates a bullish trend and a breakout below the low indicates a bearish trend.
- Confirm the Breakout with Volume: The second most crucial factor in successful ORB trading is to confirm the breakout with volume. A breakout, as confirmed by a sudden growth in trading volume, signifies strong momentum and raises the probability of resulting in a big move in the same direction.
- Set Your Entry: After price penetrates the opening range on increased volume, set your entry order at the breakdown. Market orders or limit orders can be used by traders depending on trading strategy and risk.
- Place Stop-Loss Orders: For safety in case the breakout proves to be fake, place a stop-loss order slightly below the opening range (if it is a bull breakout) or slightly above the opening range (if it is a bear breakout). This will limit the losses in case the price moves in the wrong direction.
- Take Profit or Trail Stop: After price has already moved in your direction, you can take profit at levels or trail your stop to lock in profits as price keeps moving.
Using Indicators with the Opening Range Breakout
Although the Opening Range Breakout alone will work, in most instances, it is joined by other technical indicators validating the strength of the breakout or breaking through entry levels. Be on the lookout for the following indicators:
- Moving Averages: Reaffirm the breakout direction using shorter-term moving averages (like the 9-period or 21-period EMA). When price breaks out up through the opening range and above the moving average, it’s a more bullish indication.
- Relative Strength Index (RSI): RSI is utilized to verify if the market is overbought or oversold. If the price breaks through and the RSI is 40-60, which is neutral, it indicates that the breakout has room to travel. If the RSI is above 70 or below 30, then the breakout might be facing resistance or support.
- MACD (Moving Average Convergence Divergence): A bull MACD crossover with the same direction as the breakout can be further evidence that one has the momentum on one’s side.
- Volume: Beyond doubt, the best ORB indicator would likely be volume. Heavy-volume breakout is evidence of heavy participation in the market and makes winning trades more likely.
Risk Management in ORB Trading
Risk management should be applied if you are to defend yourself against huge losses. The following are the ways you can handle risk while trading using the ORB strategy:
- Place Stop-Loss Orders: Insert a stop-loss above or below the opening range edge. This will have you close the trade immediately if the breakout is fake.
- Position Sizing: Determine how much of your portfolio you wish to risk on a trade. Golden rule is to never risk greater than 1-2% of your account on a trade. This will prevent you from losing a small fortune on a string of loser trades.
- Risk-Reward Ratio: Ensure that you are always maintaining your potential reward no less good than or better than the risk. A good ORB trade will usually be 2:1 in the risk-to-reward, i.e., risking a dollar for two dollars.
- Trade with Market Sentiment: Ensure you trade in the same direction of the overall sentiment in the market. The ORB system is optimized to function better in trending markets, thus should not be applied in low-volatility or sideways markets.
Final Thoughts
The Opening Range Breakout is a highly effective day trading strategy for market participants seeking to take advantage of early movement in the market. By reading the opening range and looking for the breakout, traders are able to get into positions with enormous potential returns. To be well-positioned, combine the ORB strategy with good risk management strategies and confirm the breakout through technical indicators like volume and moving averages.
As with any trading strategy, practice makes perfect. Start by applying the ORB technique on a demo account or with small positions until you’re comfortable with its application. With consistency and discipline, the Opening Range Breakout strategy can become a reliable method for generating profits in various markets.
FAQ
What is the best time frame to use for the Opening Range Breakout?
The ideal time frame for ORB is typically the first 15 to 30 minutes of the opening of the market. This typically is the most active and most volatile period and therefore the optimal time for breakouts.
Is it feasible to apply the ORB strategy when trading with cryptocurrency?
Yes, the ORB strategy can also be used in cryptocurrency markets. Since crypto markets are highly volatile and are open 24/7, you can adjust the time frame based on the market action during the opening hours of the major exchanges.
How do I prevent false breakouts with the ORB strategy?
To prevent false breakouts, it is important to confirm the breakout with higher volume and other technical conditions, like RSI or moving averages. It is also possible to limit your losses in case of a false breakout by placing a stop-loss outside the opening range.