God Candle Crypto Trading Explained & Strategies
Learning “God Candle” Crypto Pattern
While looking at crypto charts, there is something great about the point where one candlestick towers way above the rest. Some people even call massive spikes like those “God Candles.” They typically indicate incredibly strong momentum, likely a likely bullish reversal, or occasionally just a fast pump. Knowing how to interpret and react to those candles can leave you far in front of competition as a trader.
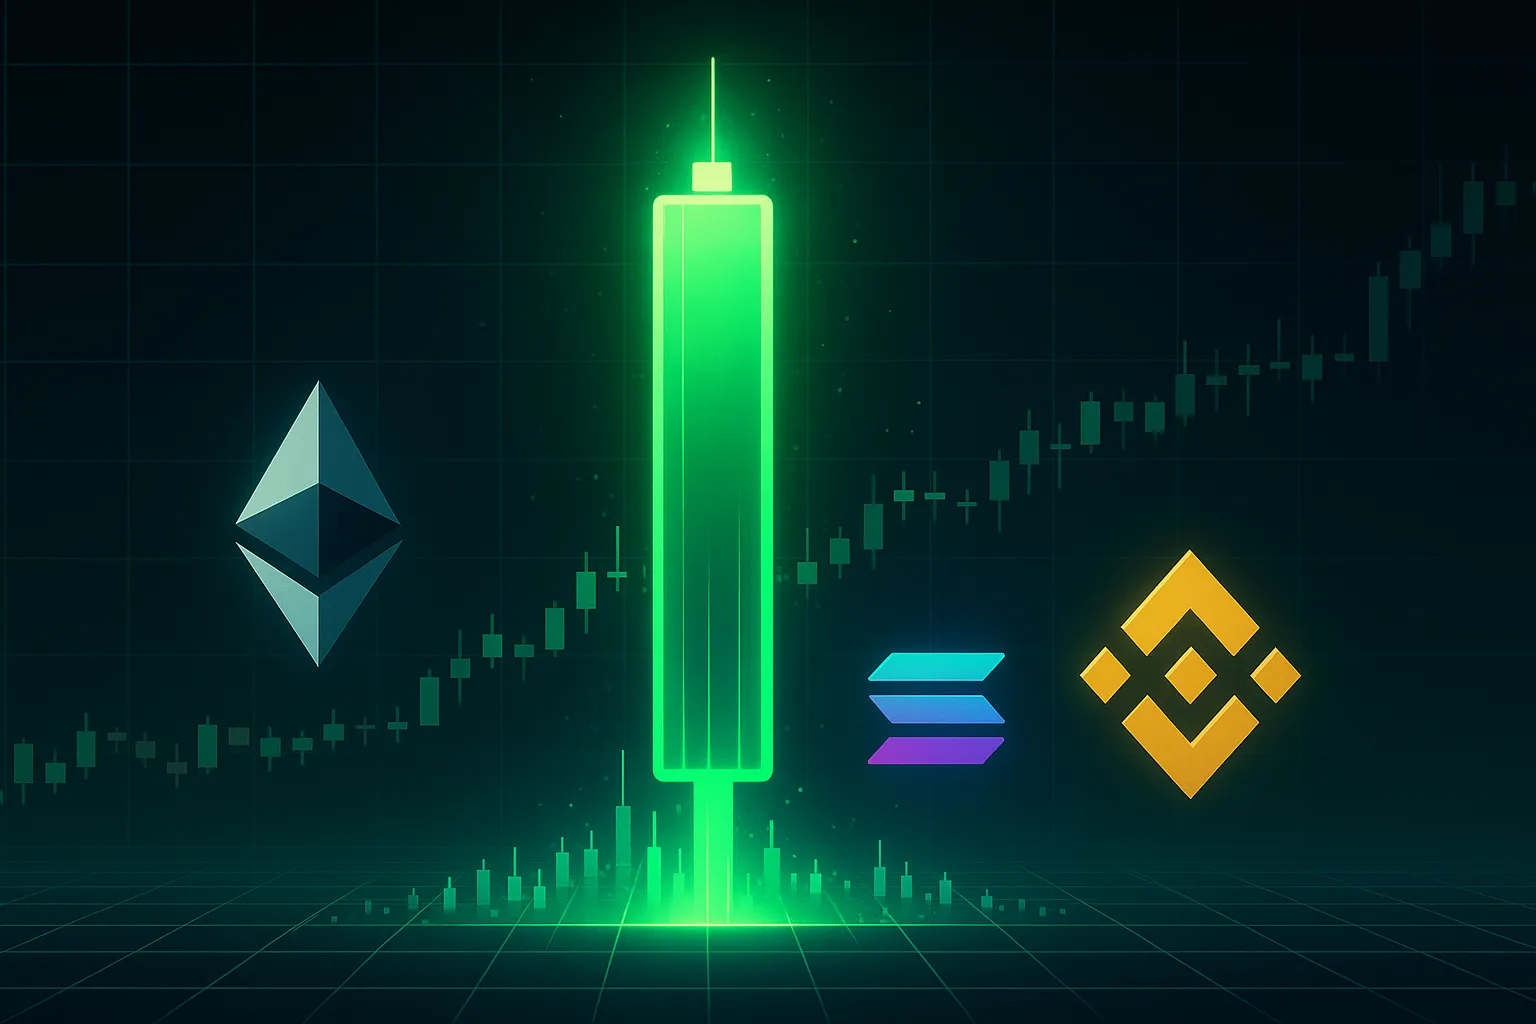
Table of Contents
- What Makes a “God Candle” Special?
- Decoding Signals: How to Spot the Real Deal
- Real-World Examples: Ethereum, SOL & BNB
- Putting It Into Practice: Strategy Tips
- Building Your Own Alerts and Widgets
- Conclusion
- Frequently Asked Questions
What Makes a “God Candle” Special?
A “God Candle” is not any old bullish candle—it ‘s one that definitely stand soutrather obviously from the crowd in terms of size and volume. Imagine a daily chart where the candlestick body takesup 10-20% of the normal daily range—that’s usually a sign of enorm ous new money coming inor enormous liquidation.
- Volume Confirmation: Spiking volume is essential—it verifies true signals while ruling out false breakouts.
- Body vs. Wicks: A large body with small wicks indicates strong buying, whereas long top wicks may indicate profit-taking.
- Market Context: A God Candle at a critical support level carries more weight than one emerging in overbought region.
- Unlocking the Signal: How to Recognize True God Candles
Decoding Signals: How to Spot the Real Deal
- Watch on Multiple Timeframes
Check shorter time frames like 1-hour or 4-hour charts to see if the move is a flash pump or an underlying trend. Then check daily or weekly charts to confirm trend alignment. - Use with On-Chain DataExchange Inflows/Outflows: A sudden withdrawal from exchanges like Binance or Coinbase can signal holders are not selling.
Whale Movements: Significant transactions (e.g., 1,000+ ETH) before a candle can signal massive price swings. - Utilize Technical IndicatorsVWAP (Volume Weighted Average Price): A close above VWAP after a God Candle indicates potential future profits.
RSI Divergence: A bull candle on a falling RSI can be a sign of market exhaustion—be cautious.
Real-World Examples: Ethereum, SOL & BNB
Ethereum’s January Surge:
On 12 Jan 2025, ETH formed a daily candle nearly twicethe size of its average, with volume increased 150%. The candle rested at make-or-break$2,500 support, and ETHquicklywenttoanall-time high—showing how context enhances the signal.
Solana’s Quick Pump
On March 8th, SOL’ its 20-day EMA, initiating a 30% upmove. Traders who entered just above the previous high wereable ride the move with minimal slippage.
BNB’s Retest Bounce:
BNB formed a massive candle at its 200-day moving average. Those who tracked the moving average zones saw a steady 15% thereafter, showing advantage of employing traditional technicals along with the God Candle pattern.
Putting It Into Practice: Strategy Tips
- Stagger Your Entries: Instead of entering all at one time as the candle closes, break your position into multiple entries to manage risk.
- Set Trailing Stops: Place a trailing stop 5-7% below the low of the candle to protect profits and leave room for growth.
- Watch Market Structure: If the candle breaks above a previous high, the follow-through resistance generally becomes support—take profits there.
- Avoid Overtrading: Not all bigcandlesresultin a continuation rally. Look for evidence of follow-through—suchas a smaller green candle on decreased volume—before adding to your position.
Building Your Own Alerts and Widgets
DIY TradingView Alerts
- Create bespoke Pine Script that highlights daily candles greater
than 150% of the average true range. - Configurealerts using this script to receive live notifications on phone or Telegram.
On-Chain Notifications:
Use a light-weight React widget listening for activity through Alchemy or Infura. Get a pushnotificationtoyourwalletapplication the moment a whale does something substantial with a candle spike.
Open-Source Scanner
Having your scanner code on GitHub not only makes you more credible but also earns you backlinks. You can build a crawler that crawls the top 50 tokens for God Candle patterns and publishes JSON feeds—good content for crypto bloggers and researchers.
Conclusion
Identifying a God Candle is like catching lightning in a bottle. Knowing why the spikehappened andhowtoleverage it within your trading ecosystem, though, can turn a fleeting pop into a lasting edge. Always remember: size isn’t everything, but context is. Overlap chart information with on-chain data, automate your searches, and always be mindful with risk.
Frequently Asked Questions
What is literally a God Candle in crypto, you ask?
It’s a very large bullish candlestick with high body and big volume, which can indicate rising buying interest or fast market action.
Do you auto-alert on God Candles?
By making a Pine script indicator on TradingView, that will identify candles more than input ATR multiplier, then through alert setting notify you by phone, Telegram, or wallet.
Will God Candles always be good buy signals?
Not always. Always verify with on-chain information, overall trend analysis, and subsequent candles to prevent false signals or pumps.
What risk management techniques should I ?
Use staggered entries, trailing stops below the candle’s low, and prepare partial profits at significant resistance levels to protect gains.