Inflation Adjusted Gold Price: Real Value in 2025
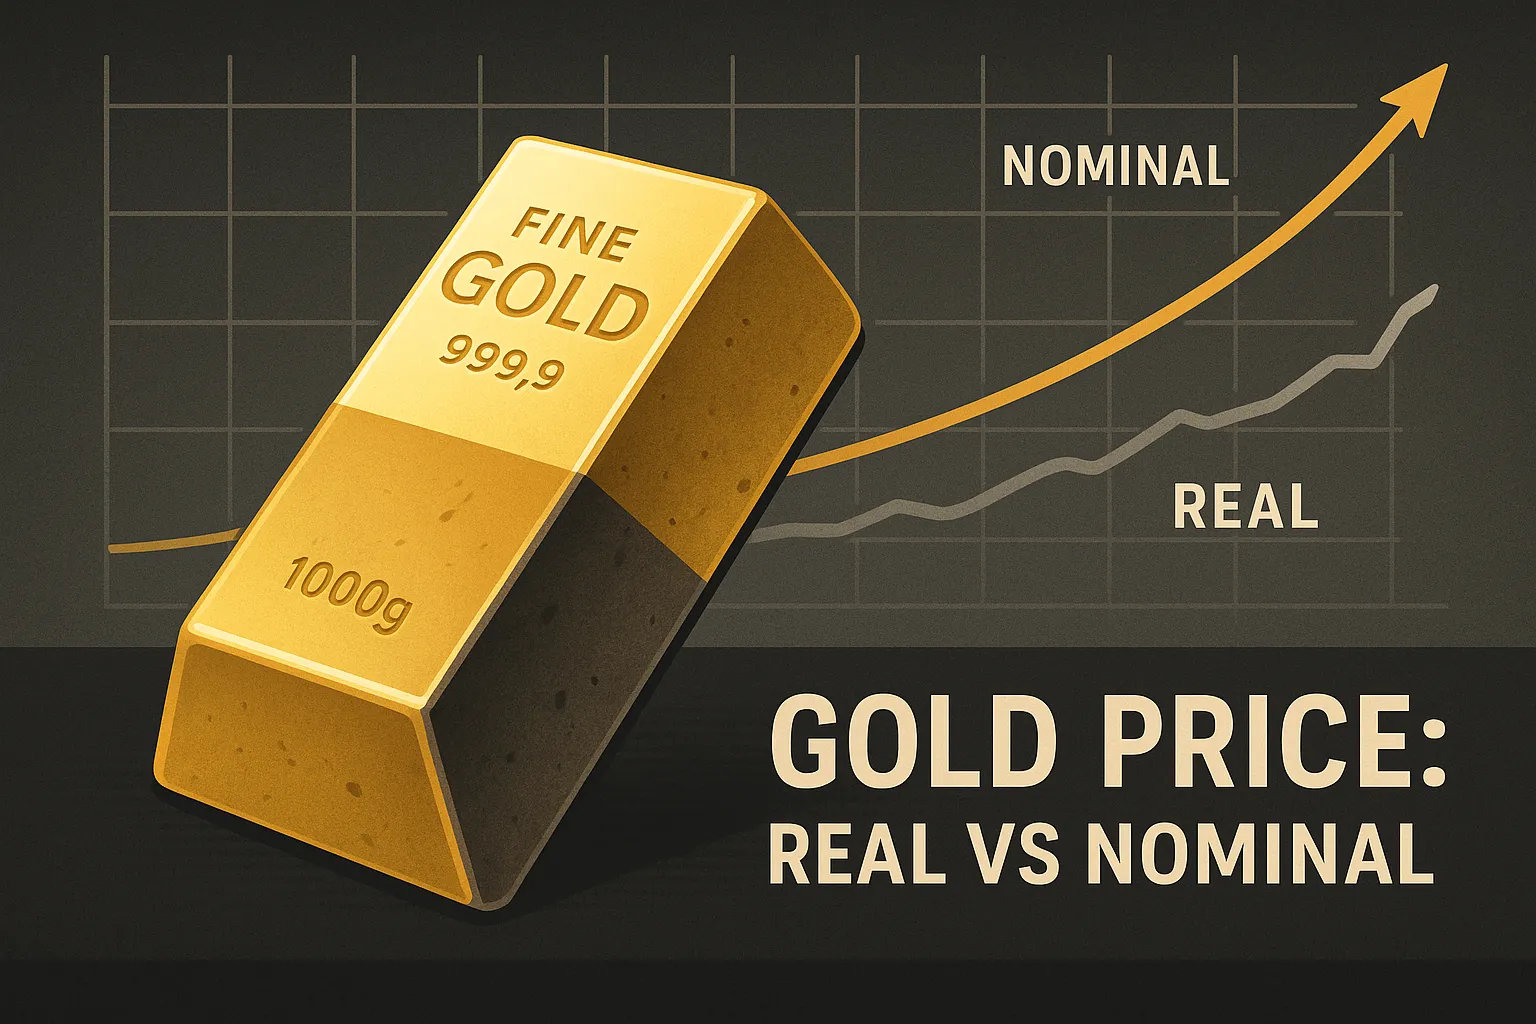
Watching Gold in “Today’s Dollars”: The Real‑Price Story
Gold’s spot price looks so up-in-your-face, but if you strip away inflation the metal’s true highs and lows have another story to tell. This tutorial compares raw spot to inflation-adjusted relatives, explains the sources of each figure, and shows how on chain oracles are revolutionizing investors’ ways of tracking the “real” price of gold.
1. How Inflation Warps a Price Chart
Look at a half-century gold chart and two dates stand out: the 1980 blow-off and the 2020 rally 2024. Inflate those prices and the 1980 top deflates, and current highs look much less extreme.
| Event | Nominal Price | Inflation‑Adjusted Price (2025 $) |
|---|---|---|
| January 1980 high | $850 / oz | ≈ $3,100 / oz |
| April 2024 close | $2,400 / oz | ≈ $2,400 / oz |
Conclusion: record headline numbers can be illusions. After inflation adjustment, in nominal terms gold still hovers around its 1980 peak.
2. Crunching the Numbers — Data & Method
Spot feed: LBMA spot or CME futures.
Inflation feed: Chainlink’s CPI oracle, or the quicker on chain alternative—the Bureau of Labor Statistics CPI.
Real Price = Spot Price × (Base‑Year CPI ÷ Current CPI)
Do that math for you, and every new CPI print (or on chain oracle update) flows straight through to your dashboard.
3. What the Adjusted Curve Actually Shows
- Purchasing power parity: Gold’s long term trend snuggles up with inflation more than it fuels it.
- Hidden drawdowns: 1990s saw flat nominal prices but 50 % real drop.
- Crisis spikes defuse: Contraction of adjusted gains after panic bids revert to normal.
4. Tokenised Gold: A Faster, Cleaner Signal
Tokens like PAXG and XAUT wrap vault stored bars in ERC 20 tokens. Blend their on chain prices with the Chainlink CPI oracle, and you have:
- Block by block “real” price updates
- Fully auditable calculation contracts
- Global access—no Bloomberg terminal required
5. Practical Tips for Analysts and Builders
Market analysts: Consider the real price percentile; over the 80th = frothy, under 40 = value opportunity.
Product groups: Have users input any year and return gold’s purchasing power in today’s dollars. Open an endpoint that gives back both spot and real prices—algorithmic traders will overwhelm you with backlinks.
6. Key Takeaways
- The 1980 peak remains intact after inflation adjustment.
- On chain CPI feeds minimize data lag from weeks to minutes.
- Gold tokenised inflates adjustment to become a call of a smart contract.
- Context is all: disregard the actual series and you’re pedalling on fumes.
FAQ
Why does 1980 remain important?
Because it is the real purchasing power record high. Nominal records since 1980 haven’t reached that inflation scaled summit.
How do I update regularly an inflation adjusted chart?
At least, monthly when the Bureau of Labor Statistics releases CPI. If you’re using the Chainlink CPI oracle, you can refresh automatically each time the oracle updates a new value (approximately once per 30 day epoch).
Is tokenised gold really backed by physical metal?
PAXG and XAUT type projects release attestation reports and serial numbers for the bars stored in their partner vaults. Always verify the latest audit before investing.
➔ Post created by Robert AI Team