Indian Stock Market Forecast: Is a Crash Coming?
Indian Stock Market Outlook: Why a Major Correction Could Be Coming
Before you is the index of the Indian stock market. Graphs like these are not just indicative of prices—they are the story of a nation’s economic past. And as with history, markets tend to have trend cycles. Now, the pendulum is in the direction of optimism, but soon enough, gravity will pull it back.
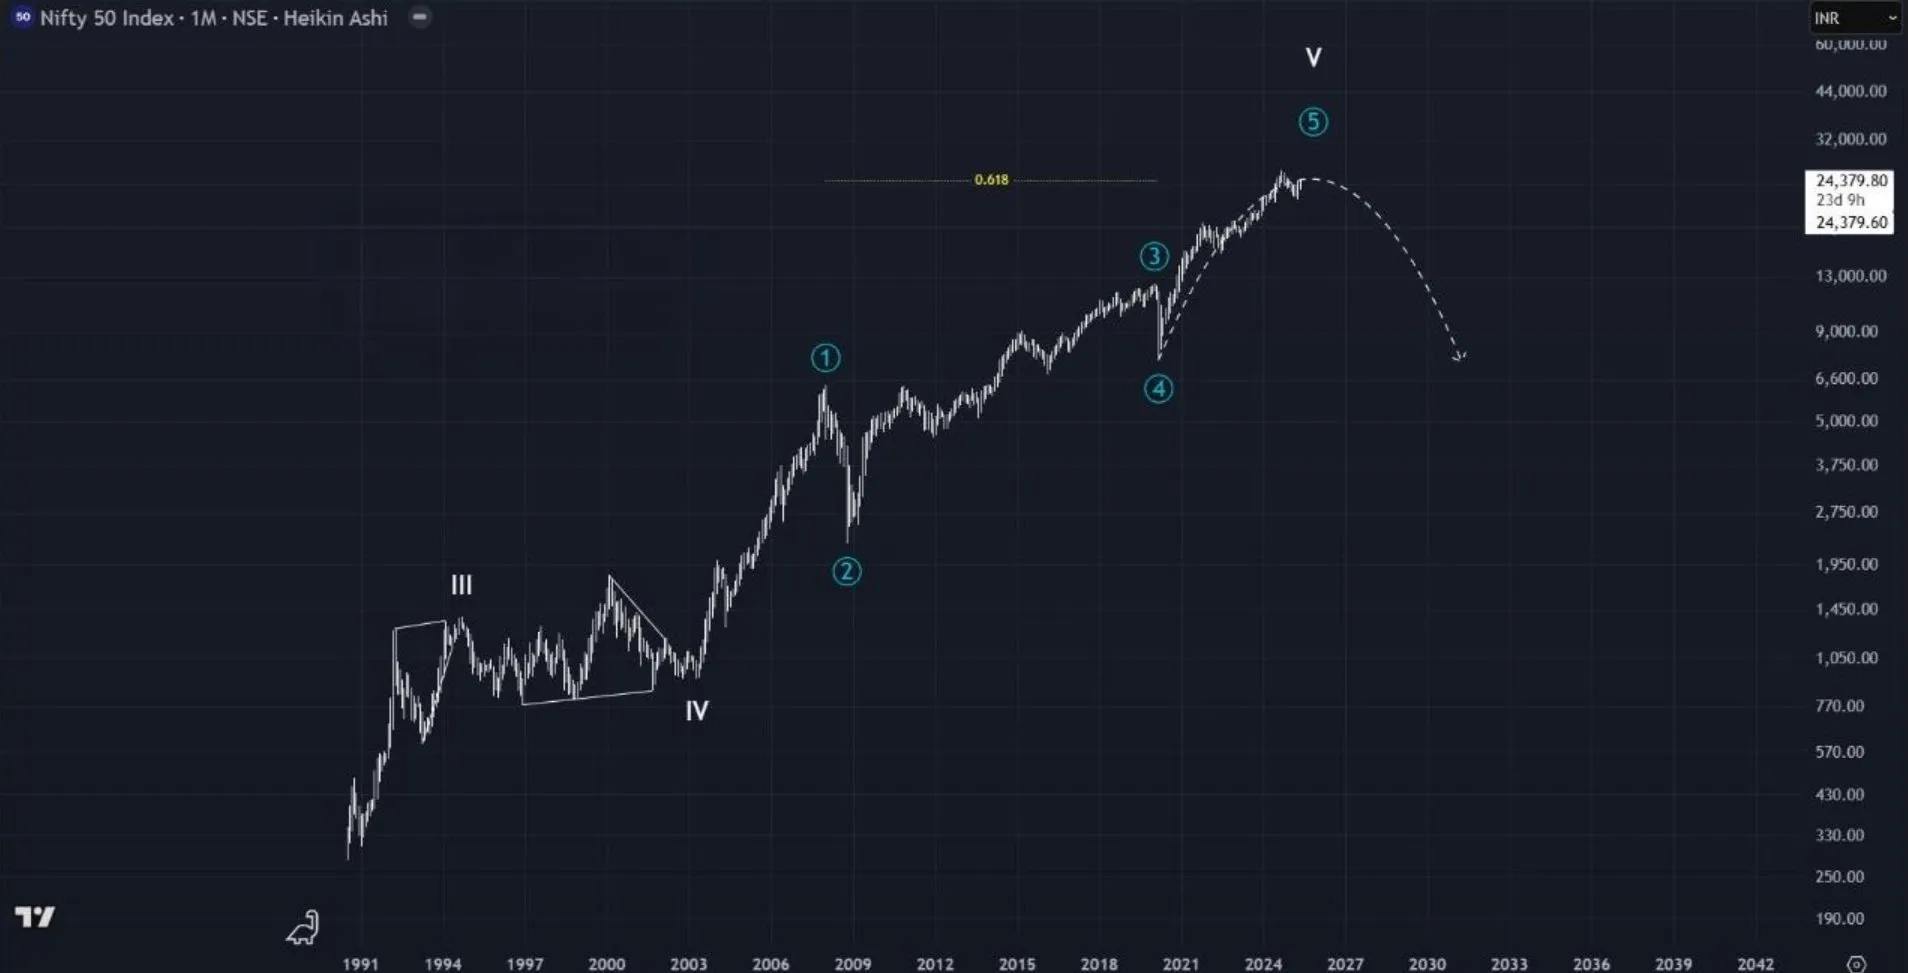
Table of Contents
- Market Cycles and Historical Patterns
- Five-Wave Completion and Key Fibonacci Level
- The Global Context: U.S. and China Indices
- Warning Signs from Other Markets
- How to Prepare for a Market Downturn
- Conclusion: Probabilities Over Predictions
Market Cycles and Historical Patterns
The Indian stock market, like all others, moves in waves. Previous corrections—in 2008 and 2020—weren’t just market blips. They were pivotal shifts that reflected deeper global problems. Each of these corrections tells us something about how economies behave under stress. And those lessons matter more than ever today.
Five-Wave Completion and Key Fibonacci Level
Technical analysts are looking at a completed five-wave structure, which is an indication that a cycle might be ending. The index has already retraced 62% of the first wave’s distance from the most recent important drop—a key Fibonacci point. That point usually becomes a turning point. When markets approach such a resistance level, there is growing volatility. Now, the chart is providing signals of building internal stress, adding odds of a higher-degree correction.
The Global Context: U.S. and China Indices
These risks are not isolated. U.S. and Chinese stock markets are also flashing red. U.S. index chart and Chinese index chart both show long-term bearish signals. Historically, major global downturns don’t happen in silos—they happen in sync. Corrections of this nature often coincide with recessions, financial crises, or geopolitical instability.
Warning Signs from Other Markets
Gold is rallying. Regional tensions are on the rise. News headlines are filled with tensions in various regions. These are not random events—they’re warning signs. We are seeing a backdrop that resembles the run-up to previous global corrections. The bigger picture tells us we are near a tipping point.
How to Prepare for a Market Downturn
In my latest video, I explain how to protect your portfolio when things get rough. Key strategies include diversifying into safe-haven assets like gold, reducing exposure to high-volatility stocks, and having cash on hand. Remember: the time to build a life raft is before the storm hits.
Conclusion: Probabilities Over Predictions
Forecasting is not fortune-telling. It’s reading signs and risk management. I don’t know the future—but the likelihood of a correction is rising. If we deal in probabilities, not feelings, we can formulate a strategic, adaptable plan. Hopefully, nothing of this occurs—but hope isn’t a plan. Read the signs. Prepare wisely. Stay alert.
FAQ
Why is the 62% Fibonacci level important?
In technical analysis, the 61.8% point of retracement is a golden ratio. Most perceive the point to be an influential reversal zone, most often leading to a change in trends.
Why did previous Indian stock market corrections occur?
The 2008 and 2020 corrections were driven by global financial crises—the U.S. housing collapse and COVID-19 pandemic respectively.
Are American and Chinese markets also signaling risk?
Yes. The present charts for both economies reflect bearish divergence and waning momentum, which aligns with the idea of synchronized global declines.
How can I hedge a crash?
Allocate to gold, short bonds, or defensive sectors. Furthermore, trim levered exposures and reserve liquidity for the next market opportunities.
➔ Post created by Robert AI Team