Chainlink Weekly Triangle Breakout Strategy
Chainlink Weekly Outlook: Triangle Formation Sets Up Major Upside
On the weekly chart, Chainlink (LINK) has completed a clear zigzag correction and is now coiling within a symmetrical triangle. The consolidation promises a powerful move to the upside on price breakout. With key levels defined—entry at $53.00, invalidation at $46.00, and profit targets at $62.00 and $75.00—traders can establish precise entries, exits, and risk management.
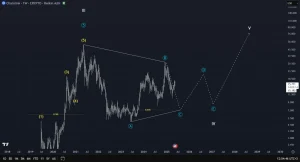
Table of Contents
- 1. Zigzag Correction Completed
- 2. Why No Impulse Wave
- 3. Symmetrical Triangle Formation
- 4. Entry, Invalidation, and Profit Targets
- 5. Extended Timeline Expectation
- 6. Broad Altcoin Confirmation
- 7. Putting It All Together
1. Zigzag Correction Completed
Structure: A textbook 5-3-5 zigzag (A-B-C) on the weekly timeframe.
Implication: Profit will be absorbed from the prior bull run, making way for the subsequent strong impulse.
2. Why No Impulse Wave
- No 5-leg advance: Recent swing highs and lows don’t create a clear five-wave pattern.
- Declining volume: Rallies have occurred on falling volume, which indicates exhaustion rather than strength.
3. Symmetrical Triangle Formation
- Converging trendlines: Two reasonable trendlines connecting the peaks and troughs of the zigzag.
- Volume contraction: Volume slowly decreases, indicating indecision.
- Touches: Two or more tests of both upper and lower boundaries confirm the pattern.
Symmetrical triangles on weekly charts have a tendency to resolve in the direction of the previous trend—here, to the upside.
4. Entry, Invalidation, and Profit Targets
| Level | Price (USD) | Note |
|---|---|---|
| Invalidation | 46.00 | Weekly close below negates the bullish triangle scenario. |
| Entry (Breakout) | 53.00 | Weekly close above confirms the breakout. |
| Target 1 | 62.00 | Measured by adding the triangle’s height to the breakout. |
| Target 2 | 75.00 | 1.5× the triangle’s height for an extended move. |
5. Extended Timeline Expectation
- Duration: Weekly triangles may take 3–6 months to resolve.
- Risk management: Be patient—set alerts, stagger profit-taking, and trail stops to breakeven after Target 1.
6. Broad Altcoin Confirmation
Chainlink is not alone: Ethereum, Solana, and most mid-cap altcoins are drawing the same weekly triangles. This sector-wide congruence raises the likelihood of a synchronized upside breakout.
7. Putting It All Together
Chainlink’s weekly chart now offers a high-probability triangle breakout trade. By entering long above $53.00, invalidating below $46.00, and scaling out at $62.00 and $75.00, traders have clear data-driven guidance. Patience will be rewarded as the pattern unfolds over the coming months—prepare your plan and be ready for the next key move.