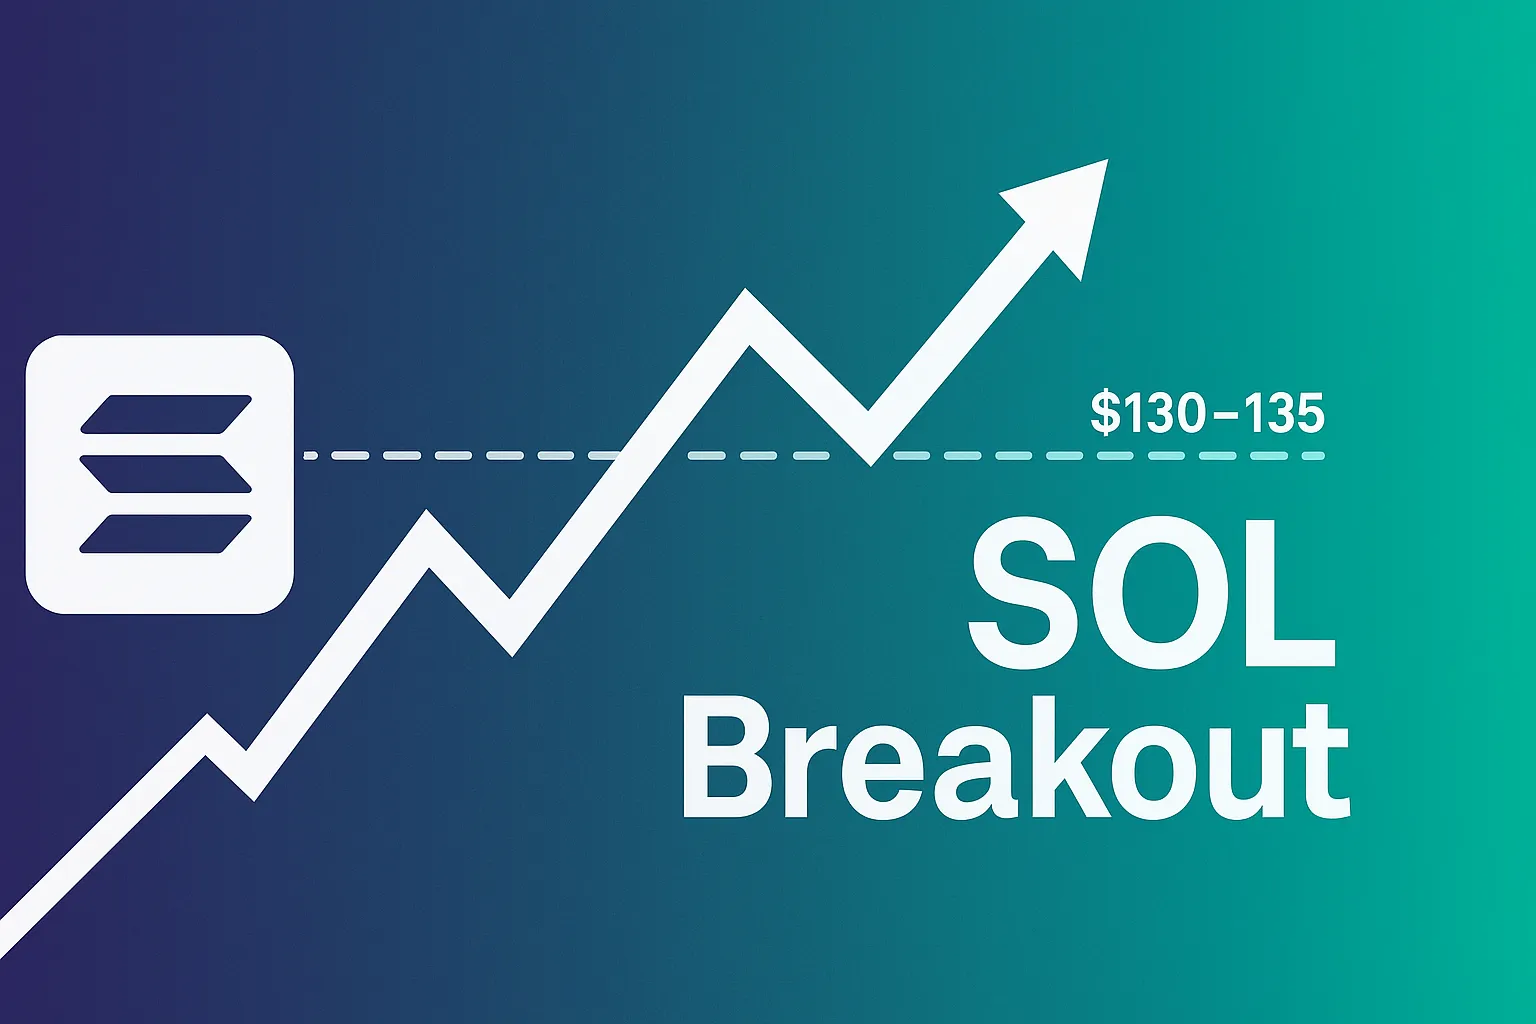
Solana at the Crossing – SOL Breakout Analysis
Solana at the Crossing: Price Breakout Analysis
In the past week, SOL has surged toward—and momentarily breached—a key resistance zone on the daily chart. In this analysis, we’ll explain what “Solana at the crossing” means for traders, review the technical setup, identify critical price levels, and outline actionable strategies for riding the next move.
Table of Contents
- Market Overview
- Technical Analysis
- Support & Resistance Levels
- Trading Strategies
- Frequently Asked Questions
1. Market Overview
Solana (SOL) was the best performer among most of the large-cap altcoins over the past month, rising more than 40% as on-chain activity remains in recovery and NFT volume comes back. Bullishness was also bolstered by recent mainnet stability improvements and a wave of new DeFi listings.
2. Technical Analysis
On the daily chart, SOL established a sequence of higher lows since mid-March, with an uptrend trendline support around $100. The critical horizontal resistance zone of $130-$135 has been approached three times, establishing it as the “crossing” point for a breakout confirmation.
- Trend: Bullish above $100, neutral-to-bullish between $100-$130
- Moving Averages: 50-day MA at $115 (support), 200-day MA at $95
- RSI: ~68, close to overbought but still with space to run
- Volume: Increases on up-days, a bullish break-out signal
3. Support & Resistance Levels
| Level | Price (USD) | Role |
|---|---|---|
| Major Resistance | 130 – 135 | Breakout zone (“crossing”) |
| First Support | 120 | Previous consolidation high |
| Trendline Support | 100 | Ascending trendline since mid-March |
| Key Floor | 90 | 200-day MA confluence |
4. Trading Strategies
Depending on your risk appetite, consider one of these approaches:
- Breakout Entry: Long if daily close > $135 with volume confirmation.
- Target: $150 – 160
- Stop-loss: below $130
- Pullback Buy: Wait for a retest of $130–$135 as new support.
- Target: $150
- Stop-loss: below $125
- Range Trade: If SOL fails to hold > $130, short under $128.
- Target: $120
- Stop-loss: above $132
5. Frequently Asked Questions
What is “at the crossing” for SOL?
It is SOL trading right at a significant resistance area—around $130–$135—where a loud break (or rejection) is apt to launch the next major directional move.
Is the breakout going to hold?
Holding will depend upon follow-through volume and overall market health. A strong daily close above $135 with rising volume would be bullish confirmation.
What if SOL reverses back below $130?
That would suggest a breakdown. Day traders can target $120 or another test of the $100 trendline support.
What are some signs to watch?
Watch the 50-day and 200-day moving averages, RSI for overbought/oversold, and on-chain metrics like active addresses and volume.


