Dragonfly Doji Candlestick in Crypto Trading
Dragonfly Doji Candlestick in Crypto: Identifying Bullish Reversals
A single crypto world candlestick can identify a turning point. This dragonfly doji is arareone — a brief-bodied candle with a long lower wick that often signals a potential bull reversal. Anytime this pattern occurs after thedramaticdrop in Bitcoin, altcoins, or DeFi coins, experienced traders tend to sit up and take notice. It’s notjust some shape on the chart — it represents a shift in the mood of the market unfolding in dynamic, live cryptocurrency markets.
Table of Contents
- What Is a Dragonfly Doji?
- Why It Matters in Crypto
- How Pro Traders Use the Dragonfly Doji
- Real Chart Examples: BTC, ETH, and DeFi Tokens
- Avoiding False Signals
- FAQ: Dragonfly Doji in Crypto
- Final Thoughts
What Is a Dragonfly Doji?
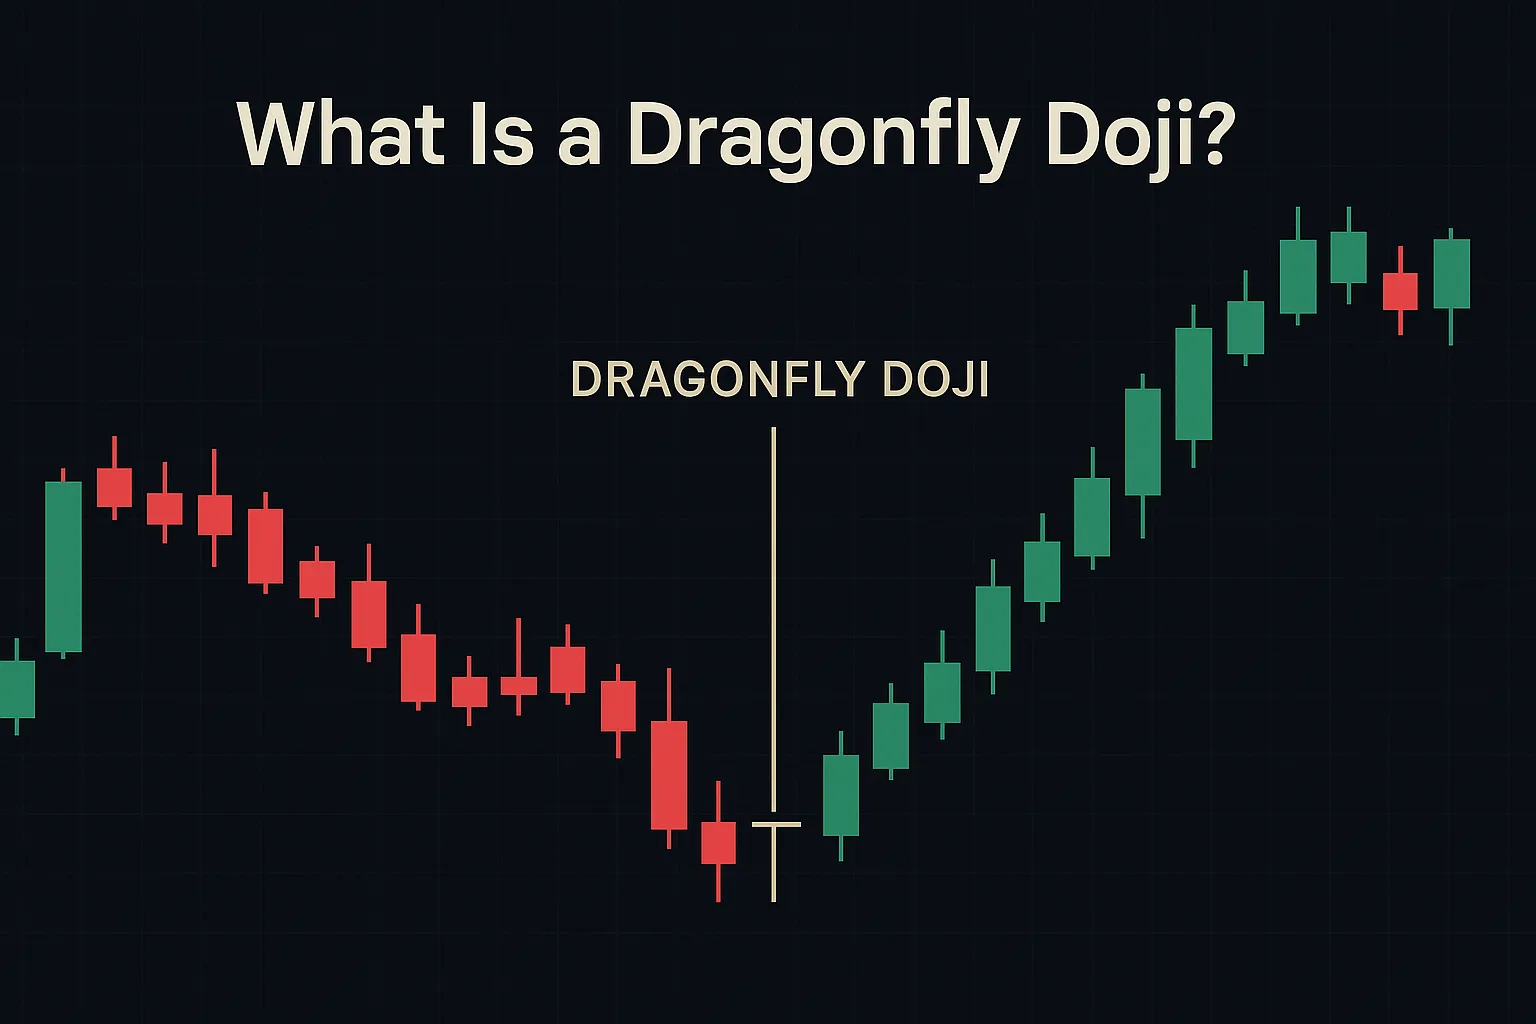
A dragonfly doji is a candlestick pattern signifying extreme demand to buy after initial selling pressure. It manifests when the opening, closing, and high are nearly equal and the low declinesbya great distance — presentingitwith a “T” shape on the chart. In cryptocurrencies, itoftenmanifestsinpanic selling phases but turns on a dime when buyers return to buying with confidence. It indicatestired sellersand cansuggest a price floor.
Why It Matters in Crypto
Crypto markets are renowned for being quick, emotional, and aptto respond swiftly. The dragonfly doji isuniquesince it is snapshotting a second when the market attempts to fall apart but fails — usually as a precursor to a reversal ahead. Traders tendtospot it on shorter charts (such as 1-hour or 4-hour) in altcoins and memecoins, particularly when liquidity is light and whales hold major levels. It also occurs on Bitcoin and Ethereum’s daily charts, typically around psychological levels or after significant news.
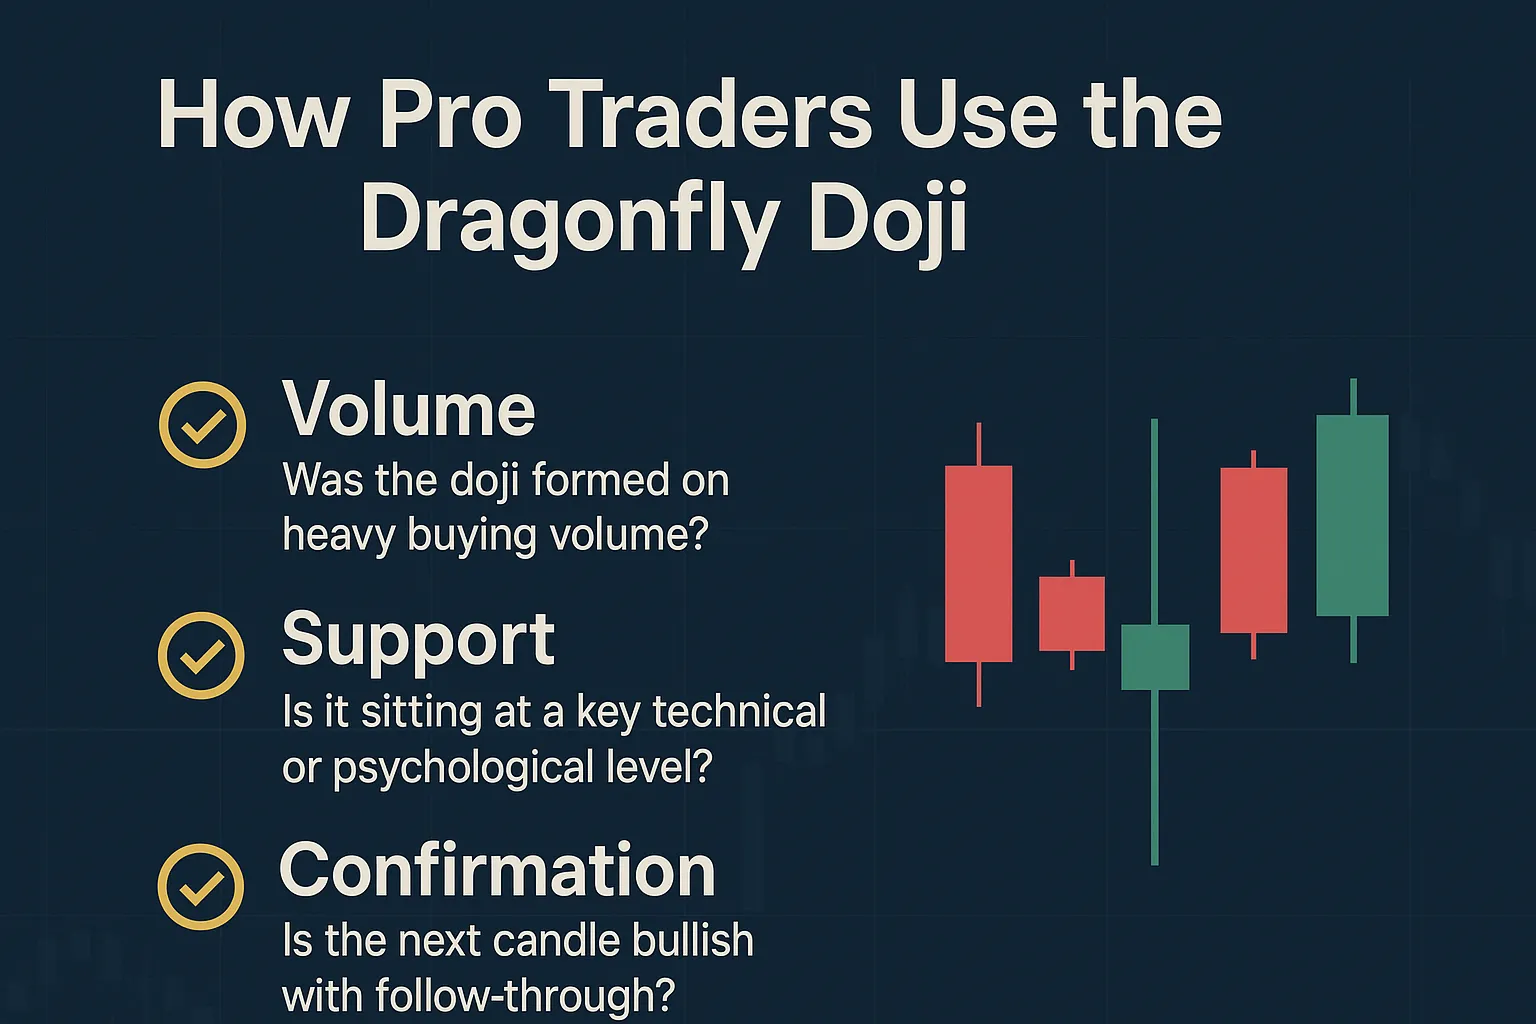
How Pro Traders Use the Dragonfly Doji